
The Shelter-in-Place order has been in effect for two months now. The State has issued a four-phase plan for counties and cities for businesses to reopen especially the ones that can operate outdoors like car washes, golf courses, constructions, etc. In San Rafael, the impact of the modified restrictions showed a slight increase in traffic. For this purpose, we chose to show data at the intersections of 2nd and 3rd Streets, which are our busiest streets in downtown where our MIOVISION cameras were installed. The data shows an increase of approximately twenty percent of the intersection volume when phase 1 was implemented compared to during the start of the Shelter-in-Place order.
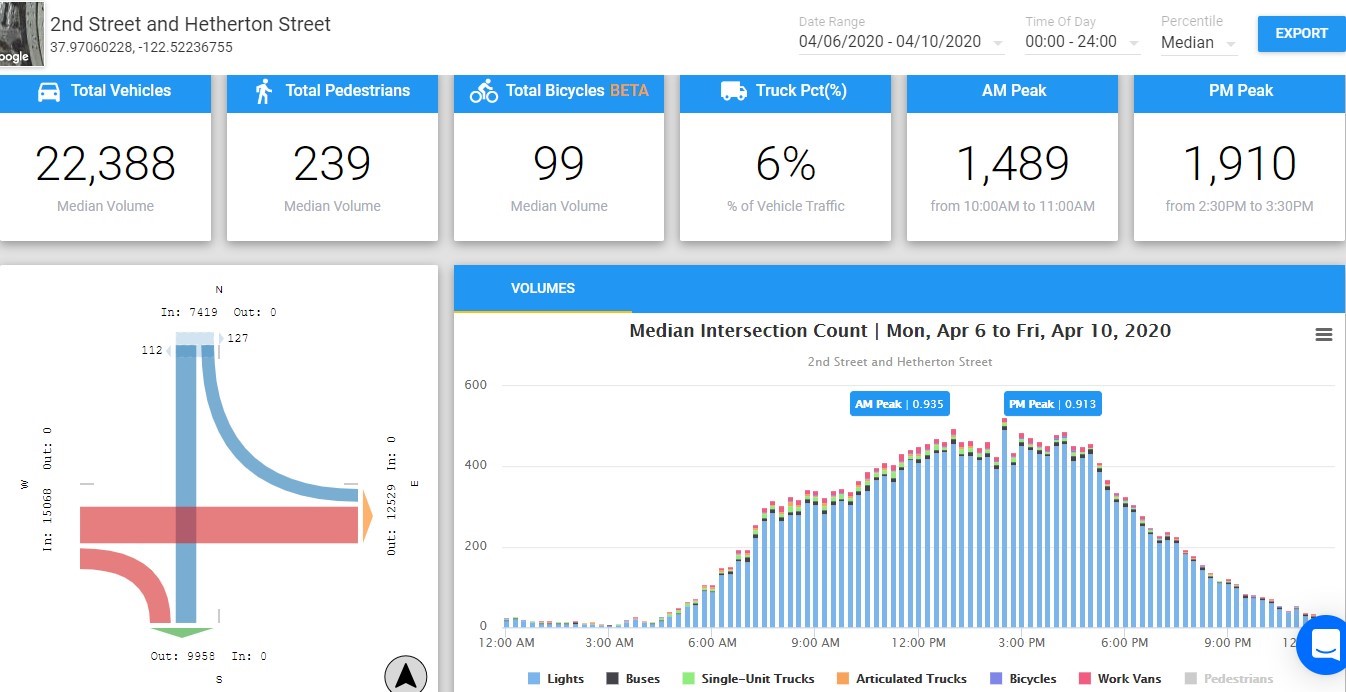
WITH SHELTER-IN-PLACE VOLUME (4/6 – 4/10/2020)
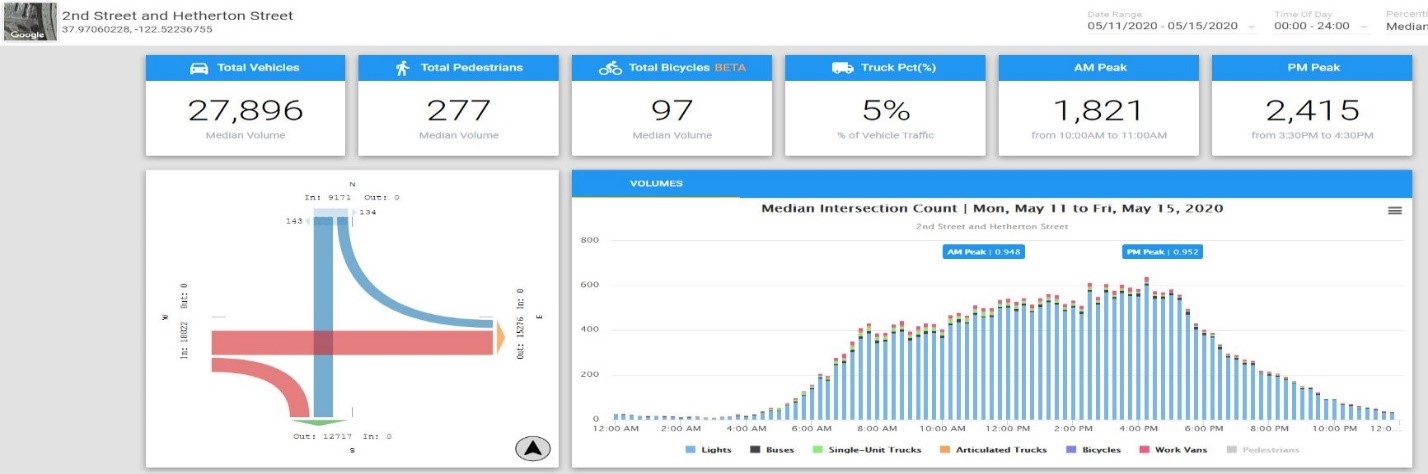
MODIFIED SHELTER-IN-PLACE MODIFICATION (PHASE I) VOLUME (5/11 – 5/15/2020)
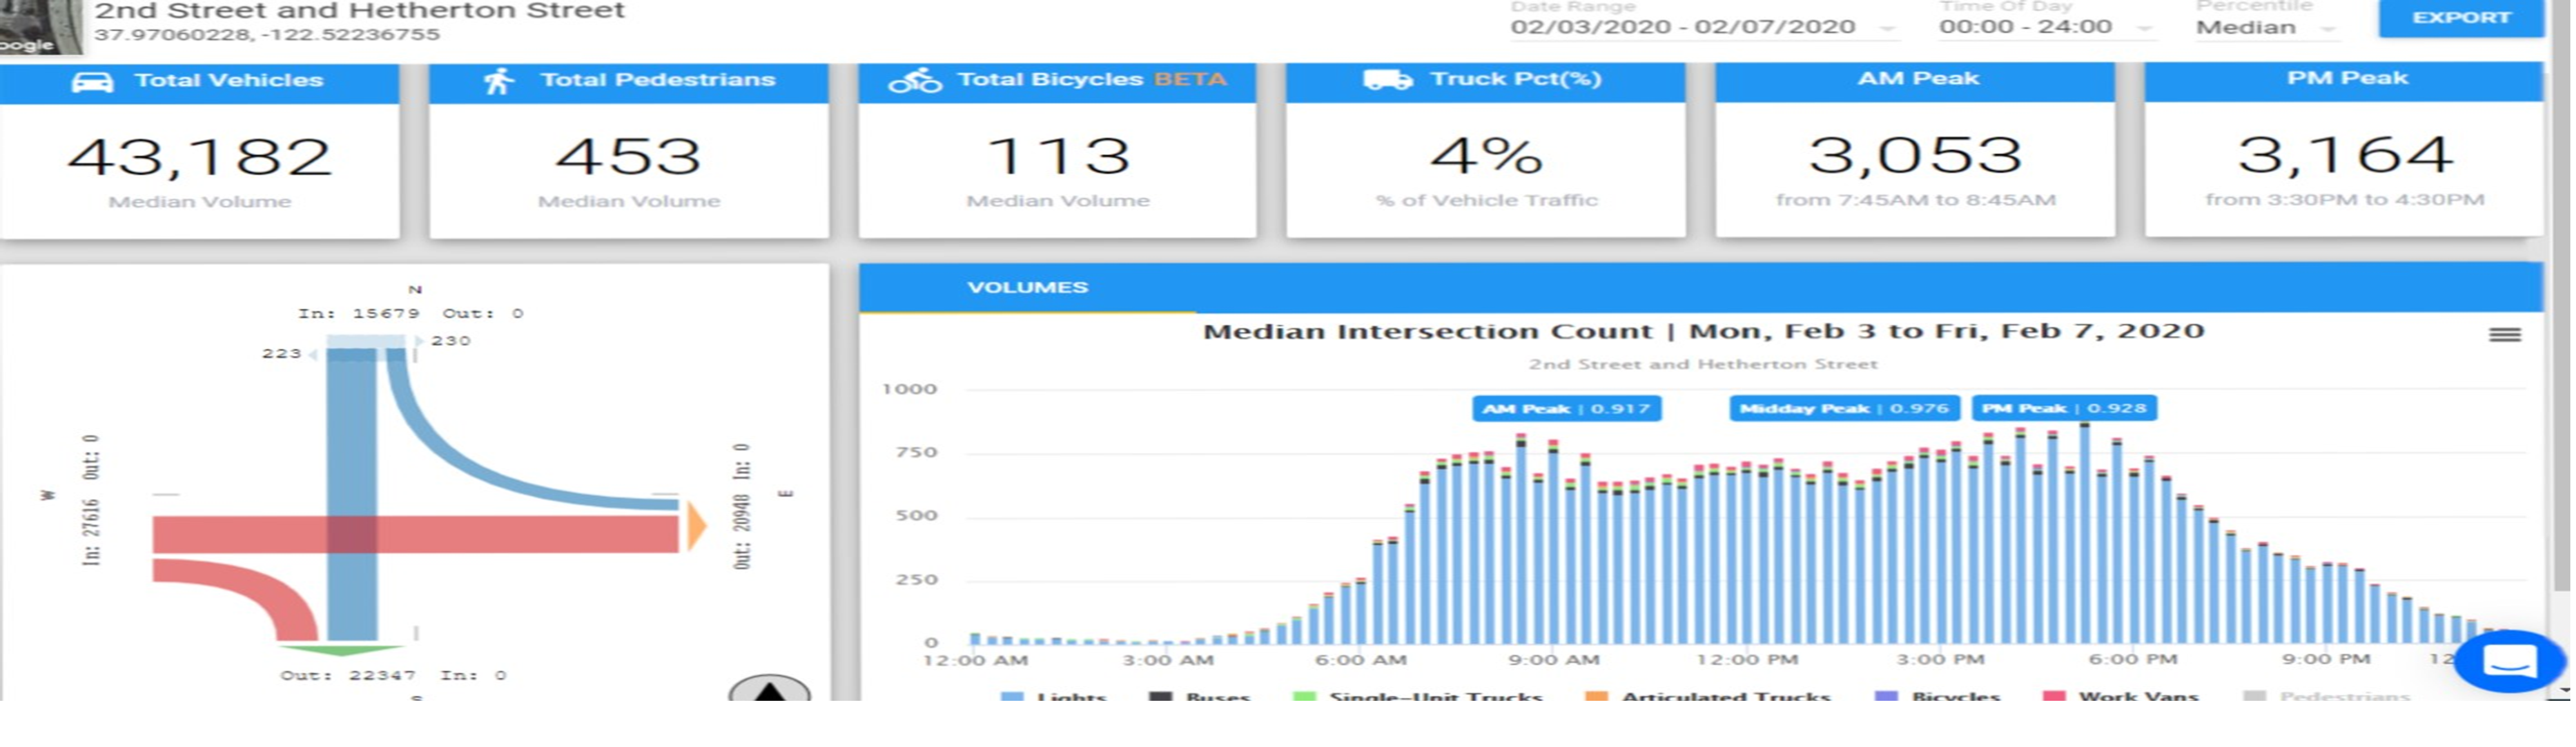
NORMAL TRAFFIC VOLUME (2/3/2020 – 2/7/2020)
Below is the travel time chart at the intersections of 2nd at Irwin/NB101 off-ramp Streets traveling west to 3rd at D Streets. It shows last April that it took 6 seconds less to travel from and to those intersections. On the Phase 1 reopening this month, there’s an additional 8 seconds to travel between those two points.
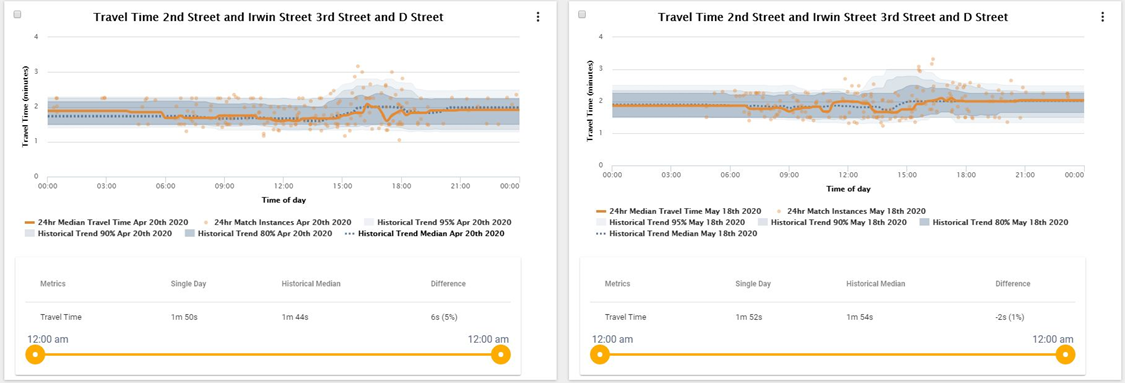
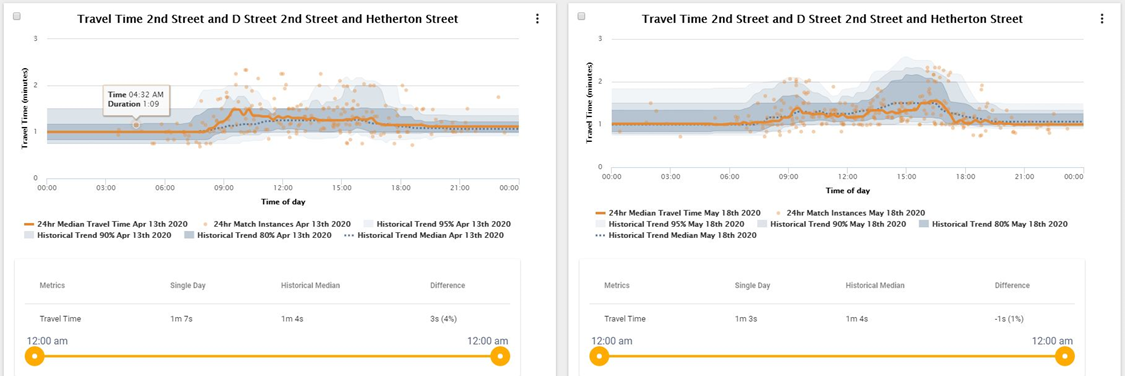
The chart below is the travel time on 2nd Street between D and Hetherton Streets traveling eastbound. It shows an increase of 4 seconds in travel time in May 2020 compared to April 2020.
The slow but steady increase traffic volumes is an encouraging indication that we are on our way to recovery. Ironically, this may be one of the few times we are looking forward to a return to our normal traffic numbers!