
Understanding our current site analytics is a piece of our new content strategy. Although they don’t tell the whole story, they provide insight on what people are looking to do on the current site and how they are getting there.
Over the past year, our site had almost 371,382 unique page views and 56.4% exited the site after visiting just one page and not interacting with it.
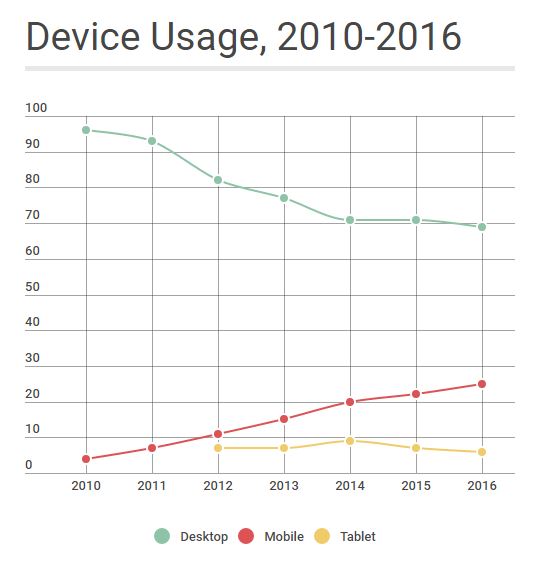
Device Usage
One major goal for our new site is to be mobile-friendly. Over the last 6 years, mobile use of the current site has increased from 4% to 31% (mobile and tablet).
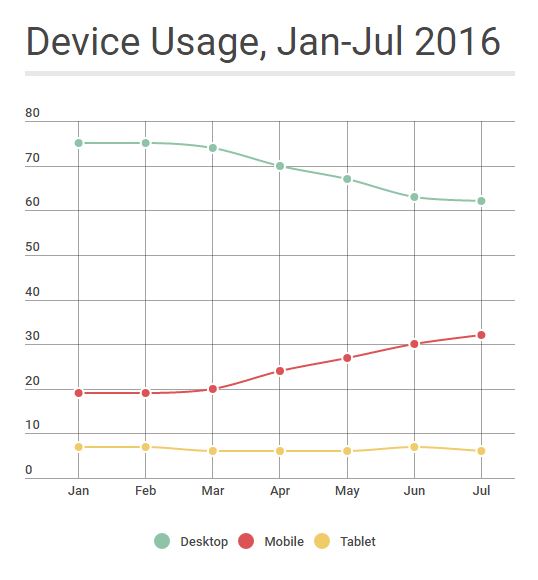
Over the past six months, mobile and tablet usage has increased even more–to 38%.
It’s also clear that San Rafael loves Apple products. A whopping 76% of mobile device users are on an iPhone or iPad. Apple? Did you hear that? We have some retail space available…
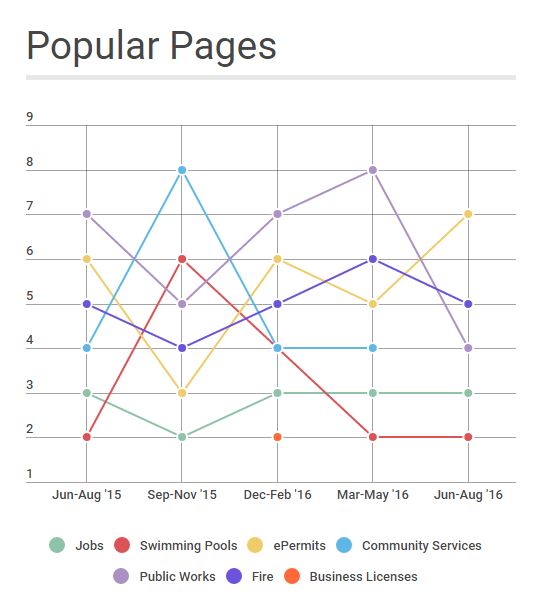
Most Popular Pages
In terms of our most popular pages, these change seasonally. During the hot summer months, about 14% of our users are looking for information about our public swimming pools. In winter, the second most popular page on the site is for business licenses (renewals are due in January). The jobs page is consistently very popular, often the second or third most viewed. It’s not shown on the chart below, the most popular page by far is always the homepage, generating about 35-45% of the site visits.
Our top pages over the past year are:
- Homepage (24.2%)
- Jobs (3.7%)
- Terra Linda Pool (3.3%)
- Community Services (2.1%)
- Fire Department (2.1%)
- ePermits (2.1%)
- Hamilton Pool (1.9%)
- Business Licenses (1.8%)
- Public Works (1.7%)
- Planning (1.7%)
Entering and Exiting
In terms of entering the site, in summer about 20% of the users are coming in via pages about a public swimming pool. Even in the fall, the pools get us the second most entries to site with over 11%. In winter, about 8% of our site users enter via the business license page. On average, our homepage is responsible for about 42% of the site entries.
Many of the most common exit pages indicate the services people are coming to our site to use — they are looking for job listings (5.5%), business licenses (2.8%), building permits (2.6%), and parking citation appeals (1.8%). 11% of site visits leave after looking at information on our public swimming pools. They are also leaving the site after finding information on public meetings, community services, fire, and business.
Homepage Action
For users entering via the homepage, 15% are going straight to the jobs page, 7% are looking for a permit, 7% click to the Community Development page, 5% want information about the City Council, and 4.5% head to the Community Services page (let me guess–they want know when the pool opens).
Over the next few weeks, we’ll be looking closer at our analytics as we focus and develop our content strategy. Clearly, the swimming pools page is going to be an important one. Right now, to find out the hours for the Terra Linda Pool from the homepage, you’ll need to click find Parks & Recreation or Community Services through the menus, toggle to pools on the left menu, and then click on this PDF called 2016 Terra Linda Pool Schedule. Let’s make this easier.